EXAMS
The Academy has a dedicated Exams Officer to ensure examinations are efficiently organised, they are also on hand to help students with any queries they may have about exams before and after they take place. If you wish to contact the Exams Officer please email solihull.exams@graceacademy.org.uk
Collecting Certificates
If you are looking to collect exam certificates could you please contact us by email at solihull.exams@graceacademy.org.uk regarding these. It is important you collect these as soon as possible as they will only be stored with us for a limited amount of time. It can cost around £50 – £80 for replacement certificates so it is important that these be collected. (Please see https://www.gov.uk/replacement-exam-certificate for further details about replacing certificates).
Please contact the exam officer before coming to the school to collect any exam certificates. If the Exam Officer has your certificates they will arrange a date at your best convenience between our school hours for you to collect these. This will enable us to prepare them and have them ready in reception for your arrival.
Requirements for collecting certificates
When collecting certificates you will need to bring some form of Identification (Driving License, Passport etc). If someone is collecting the certificates on your behalf you must let the Exams Officer know prior to the collection date. This person will need to be named to the Exam Officer and will need to bring Identification with them. They will need to bring a signed letter of authorization from the person whose certificates they are collecting.
Lost Certificates & Replacements
If you have lost your certificates we may be able to provide a statement of results. However we do not hold any copies and are unable to replace certificates ourselves. The Exam Board will need to be contacted regarding obtaining further copies as replacements by the candidate. For certified proof of results please follow this link for advice: https://www.gov.uk/replacement-exam-certificate
Information for Candidates
Students due to sit examinations, as well as parents/carers of these students, should read through and familiarise themselves with the below documents, as they contain some key information, regulations and guidance which students need to be aware of.
EXAM RESULTS
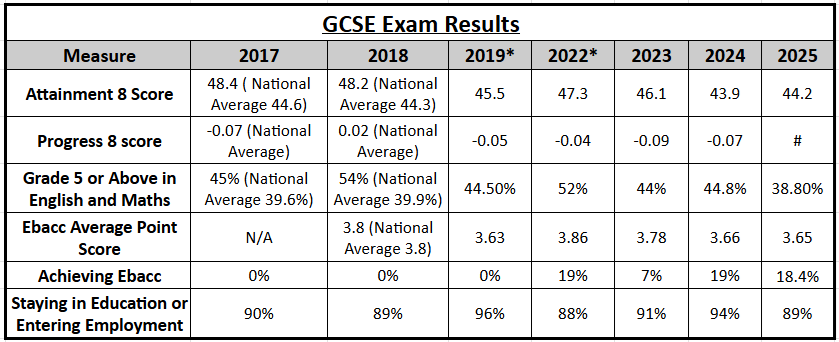
# Progress 8 scores are not able to be calculated for academic years 2024/25 and 2025/26. This is because there is no KS2 assessment data available to calculate the baseline for Progress 8 for these years due to the Covid-19 disruption.
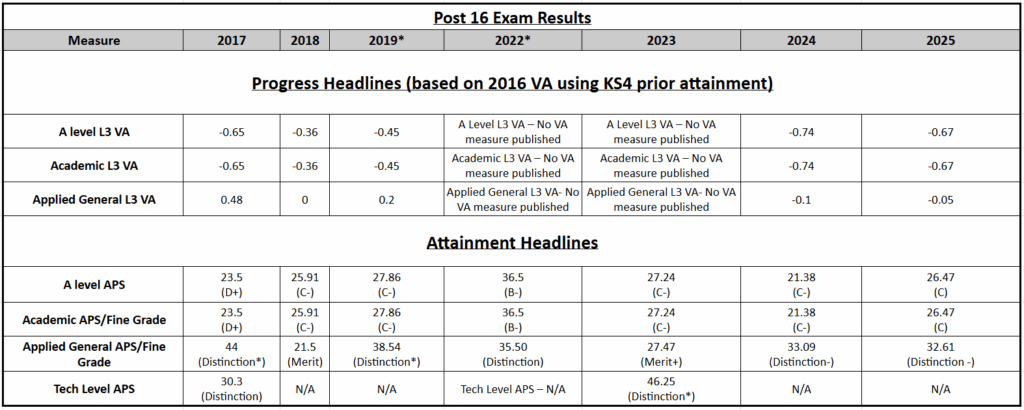
* Due to the uneven impact of the pandemic on school and college performance data for the academic year 21/22, the Department for Education recommends not making direct comparisons with previous years or between schools or colleges
* Due to the uneven impact of the pandemic on school and college performance data for the academic year 21/22, the Department for Education recommends not making direct comparisons with previous years or between schools or colleges
Post 16 Information
Retention
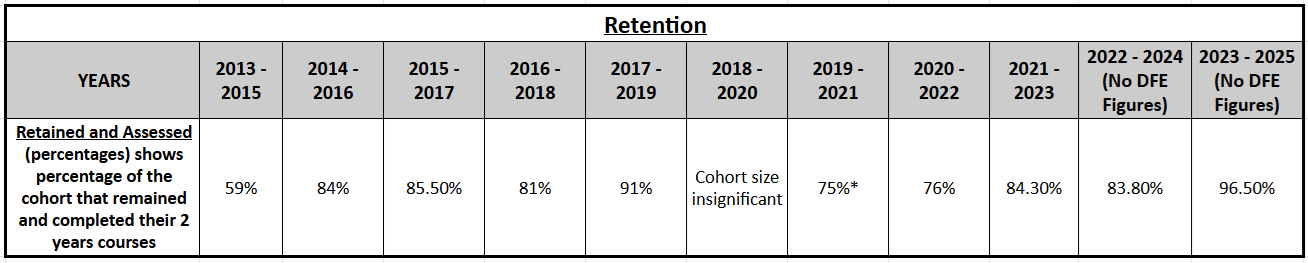
*2019-21 Small cohort size so percentages skewed. Retention was affected by Covid and school closures.
Destination of Post 16 Leavers
More information is available on the Department for Education Website
Resilience Arrangements: The government does not expect there to be a situation where exams do not go ahead, however it is sensible to have contingency plans in place, even for extremely unlikely scenarios. The school has collected evidence using Ofqual guidance in line with our existing assessment arrangements. This evidence would be used to determine grades in the unlikely event that exams and assessments could not go ahead as planned.